Welcome to My MATH 230 Data Visualization Portfolio
This website is a collection of visual work created throughout the semester in MATH 230. The projects on this site explore how data can be transformed into visual stories through color, structure, creativity, and statistical thinking.
The portfolio includes earlier visualizations from the semester, including generative artwork, a ggplot extension project, an introductory statistics dashboard, and a hand-drawn data postcard. It also features a larger virtual art exhibit built around a real-world dataset.
Featured Exhibit: The Architecture of Sleep
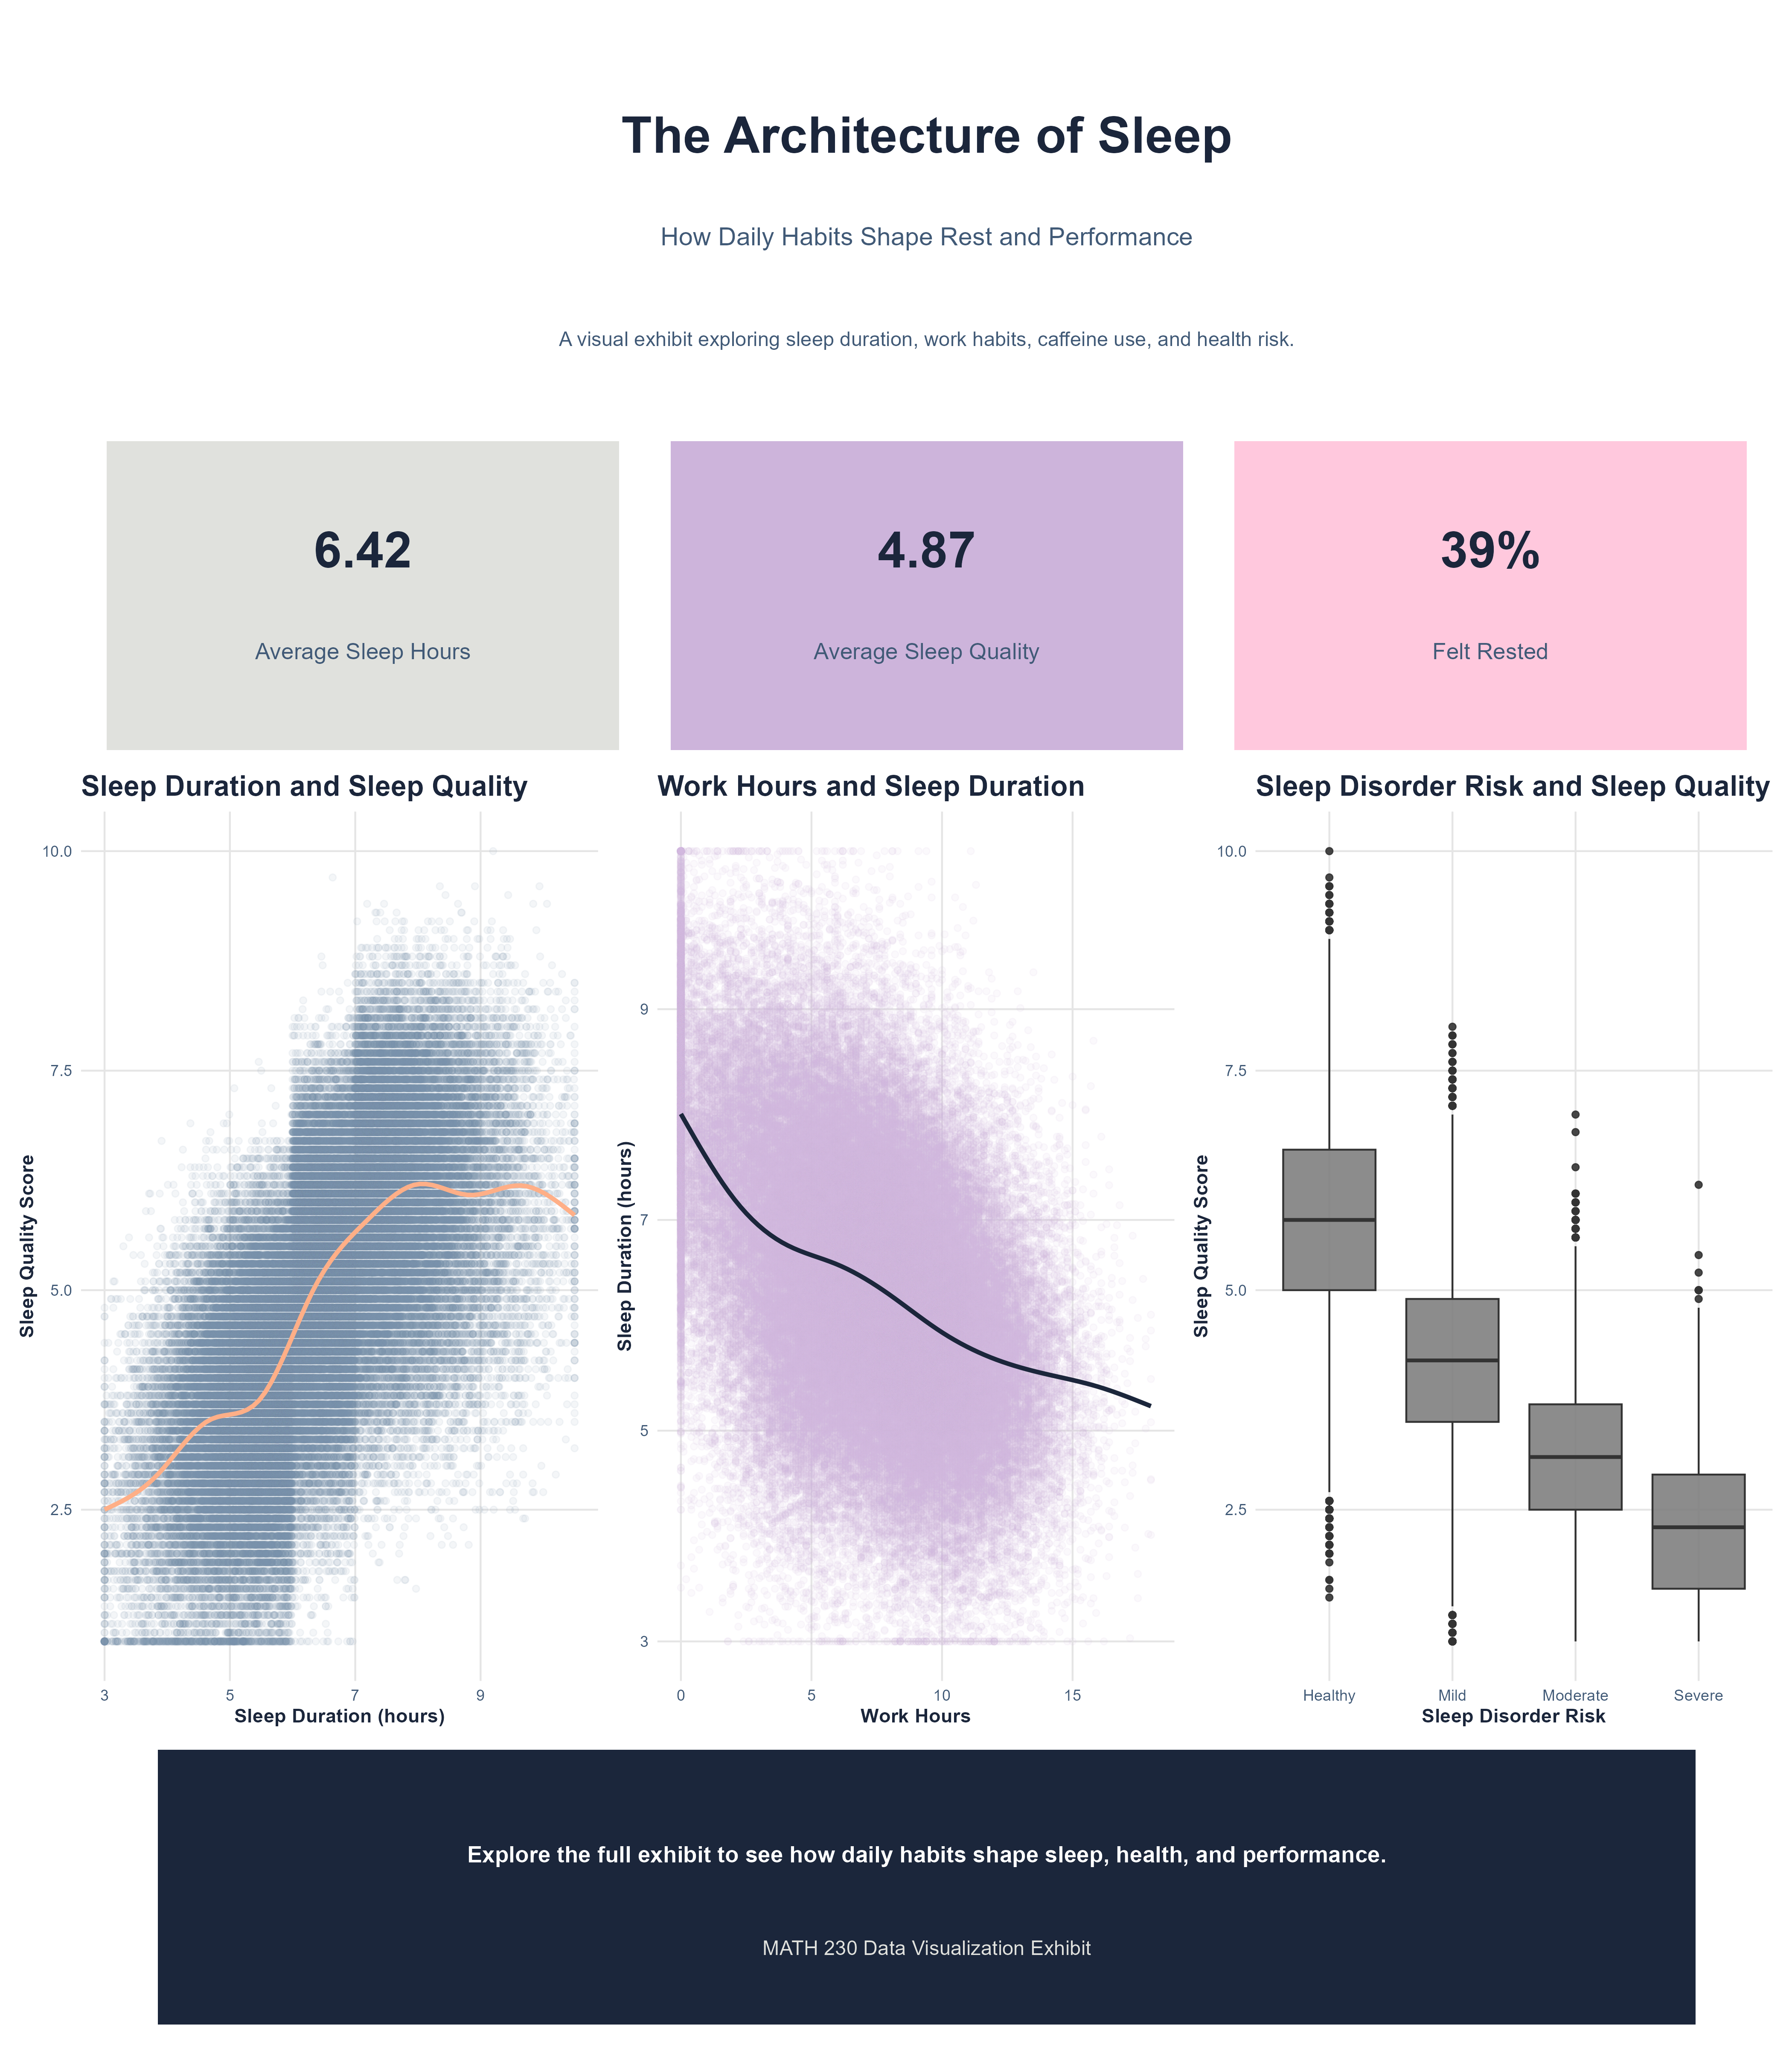
The Architecture of Sleep is a virtual data art exhibit about sleep health, daily habits, and performance. Using a real-world dataset from Kaggle, this exhibit explores how sleep duration, work hours, caffeine use, sleep aids, health risk, and cognitive performance are connected.
The exhibit begins by introducing the overall distribution of sleep duration and sleep quality. It then moves into a deeper story about how daily routines and stimulants may shape rest. Finally, it connects sleep patterns to health risk and cognitive performance.
The infographic below serves as an advertisement for the exhibit. It uses the same night-inspired color palette as the full project, with deep blues, soft lavender, moonlight gray, and warm coral. These colors help create a calm visual identity that reflects the theme of sleep while keeping the graphs readable and engaging.