The Architecture of Sleep
A data visualization exhibit exploring how daily habits shape the way we sleep.
Context
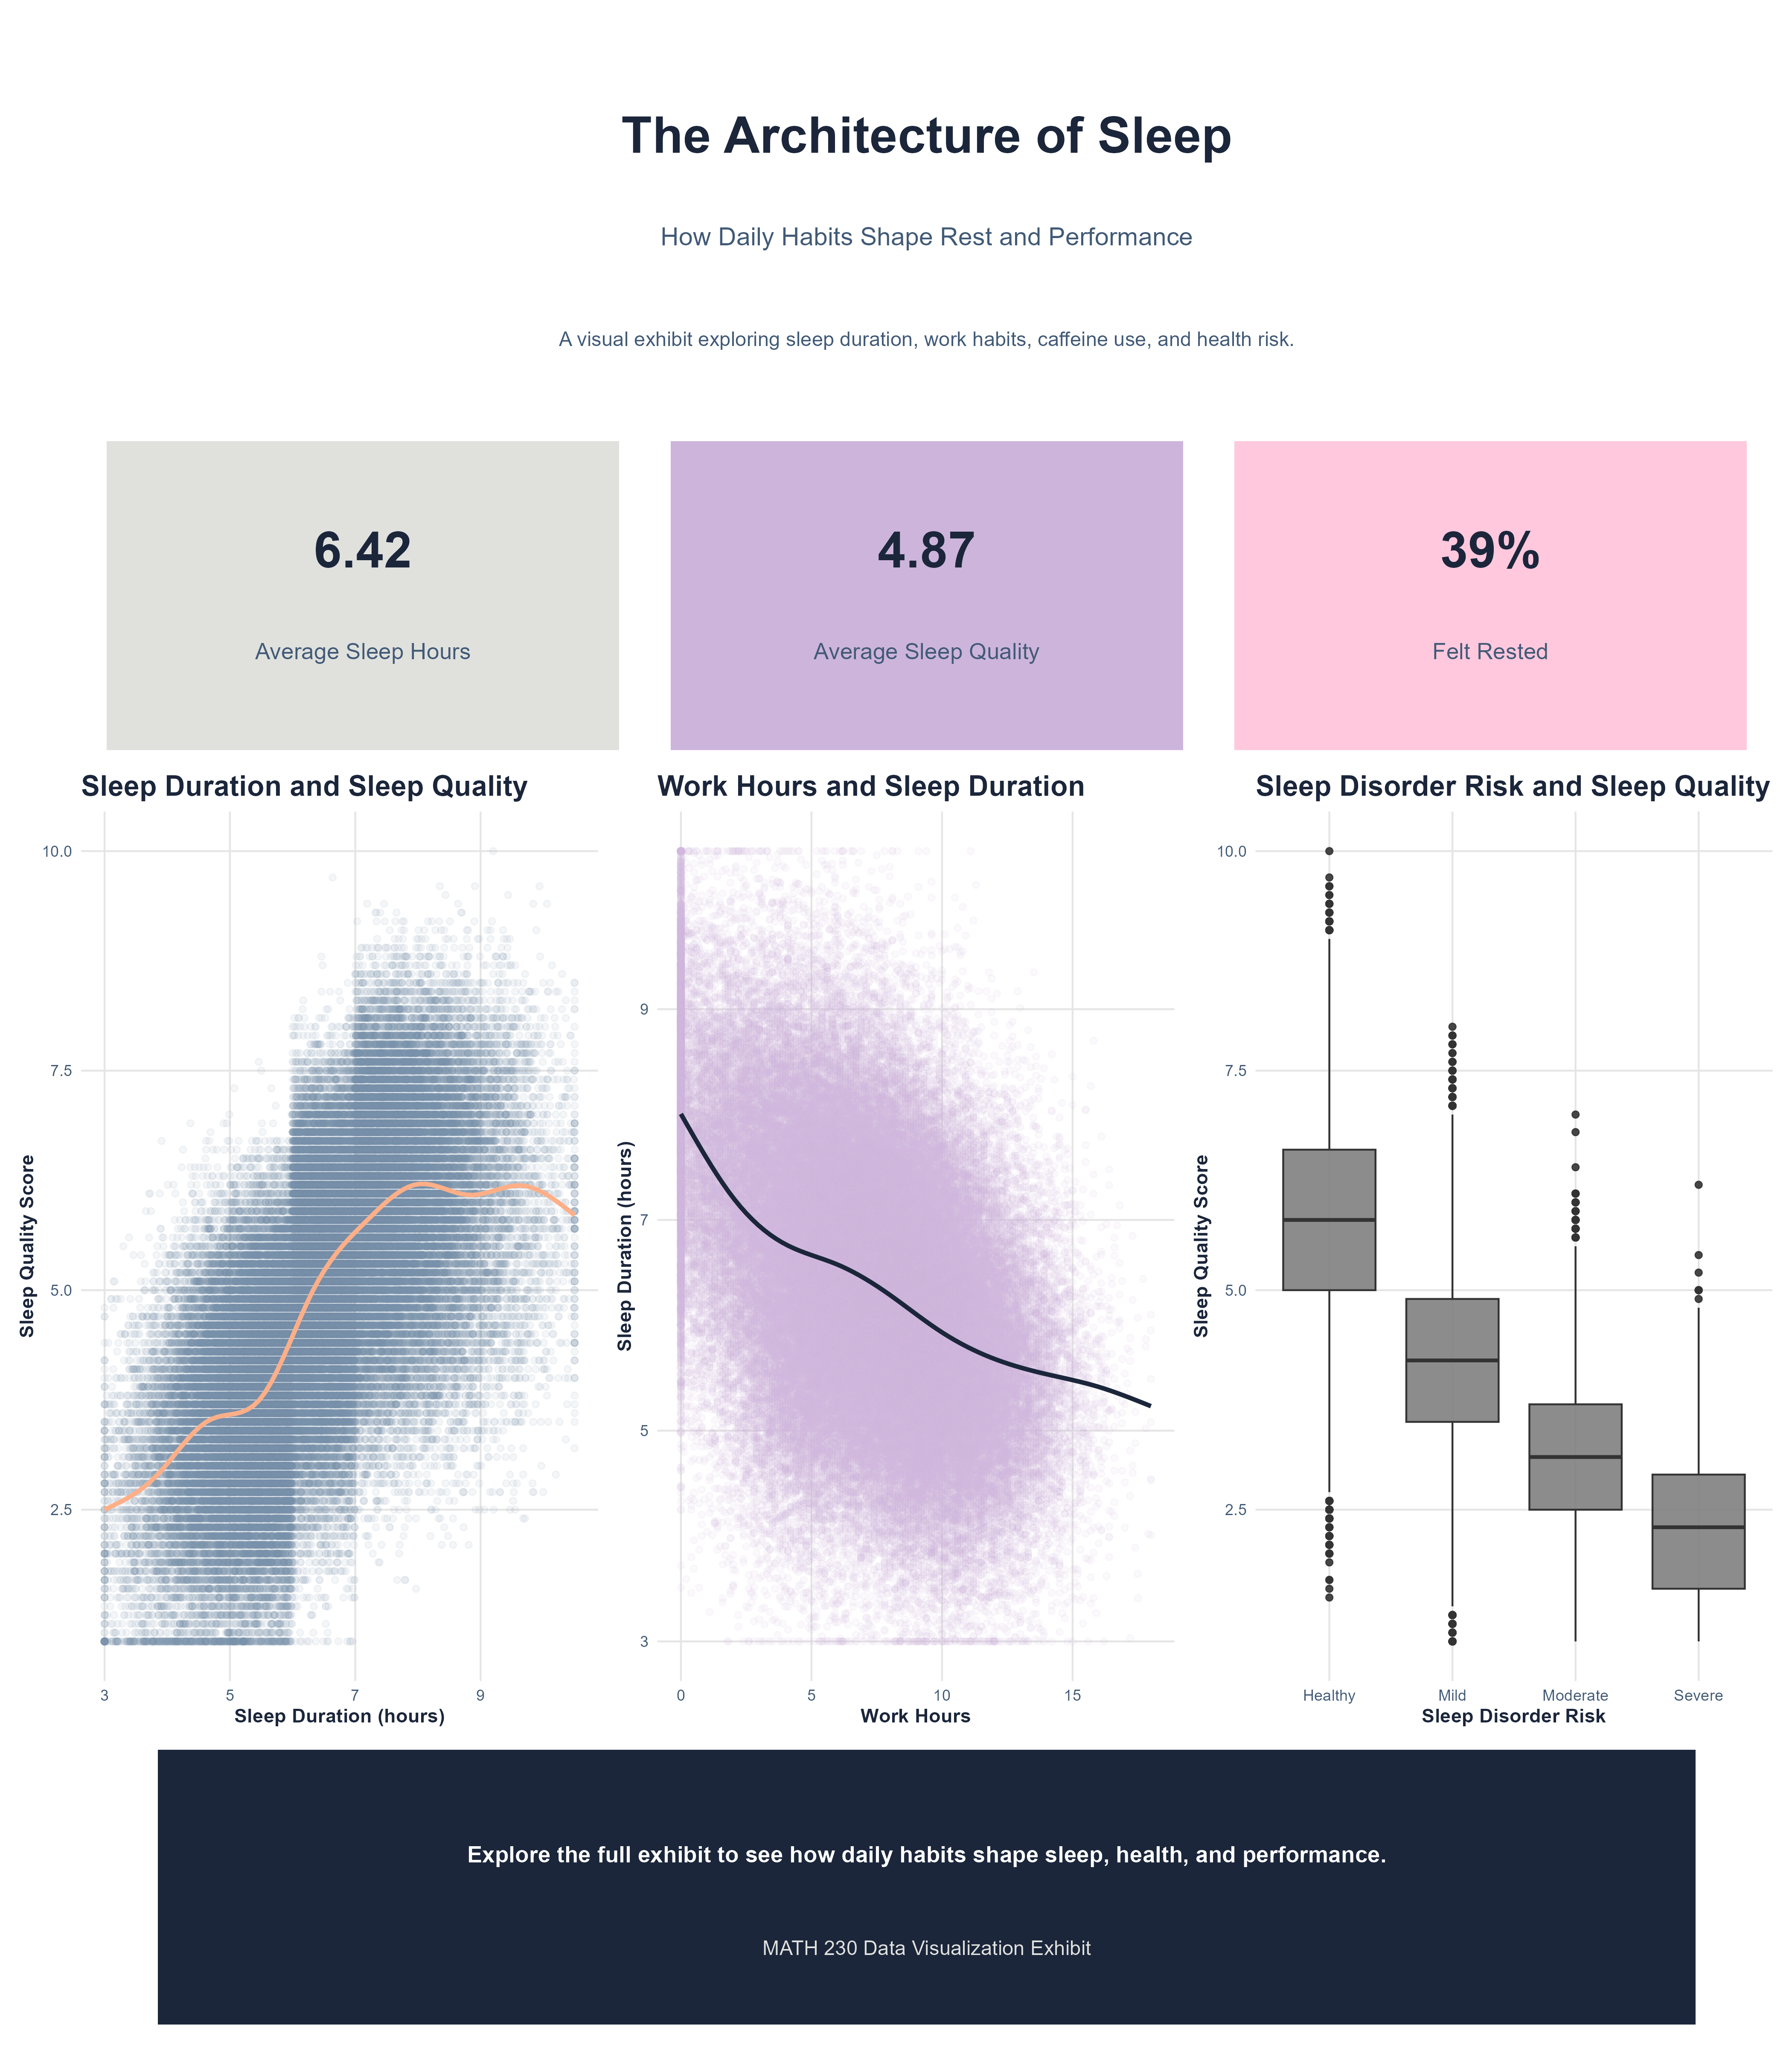
Built for MATH 230: Data Visualization & Computing as a Distill website and virtual art exhibit. The project uses a real-world sleep health dataset to explore how bedtime habits, screen time, caffeine, sleep disorder risk, and cognitive performance connect to sleep quality.
What I built
- A 10-visualization storyboard moving from sleep distributions through daily habits, health, and performance
- A consistent visual system, with a custom night-inspired color palette, applied across the exhibit, charts, and supporting pages
- Exploratory views of sleep duration, quality, work hours, screen time, caffeine, sleep aids, and cognitive performance
- A nonparametric randomization test comparing sleep quality between low and high bedtime screen-time groups
- A contour-density view of sleep duration and cognitive performance
Dataset
Sleep Health and Daily Performance Dataset (Kaggle) — about 100,000 observations and 32 variables, including sleep duration, sleep quality score, screen time before bed, caffeine intake, sleep disorder risk, and cognitive performance score.
Stack
R, R Markdown, ggplot2, tidyverse, Distill, Beamer (LaTeX), and GitHub Pages.